



UIDAI Biometrics SDK Benchmarking Challenge
These comments provided by Neurotechnology are based on the UIDAI Biometrics SDK Benchmarking Challenge leaderboard, reviewed on June 8, 2026. (archived snapshot)
In the UIDAI Biometrics SDK Benchmarking Challenge 2025, Neurotechnology’s fingerprint algorithm placed first in the fingerprint category. Neurotechnology also participated in the face and iris categories, placing third in face and second in iris.
What is the UIDAI Biometrics SDK Benchmarking Challenge?
The UIDAI Biometrics SDK Benchmarking Challenge is an evaluation organized by the Unique Identification Authority of India (UIDAI) in collaboration with the International Institute of Information Technology, Hyderabad (IIIT Hyderabad). It benchmarks 1:1 biometric verification algorithms — software that decides whether two biometric samples belong to the same person.
The challenge attracted 2,106 applications from technology providers and research institutions worldwide. Evaluations covered three biometric modalities: fingerprint, face, and iris.
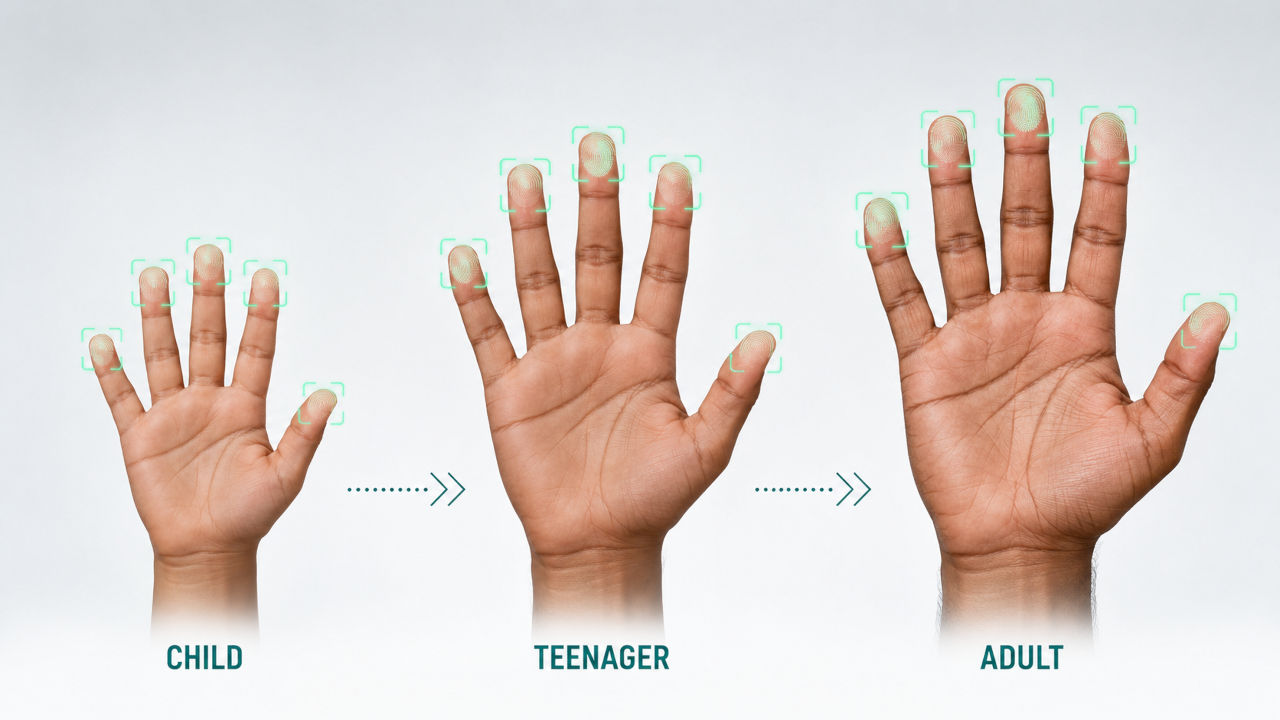
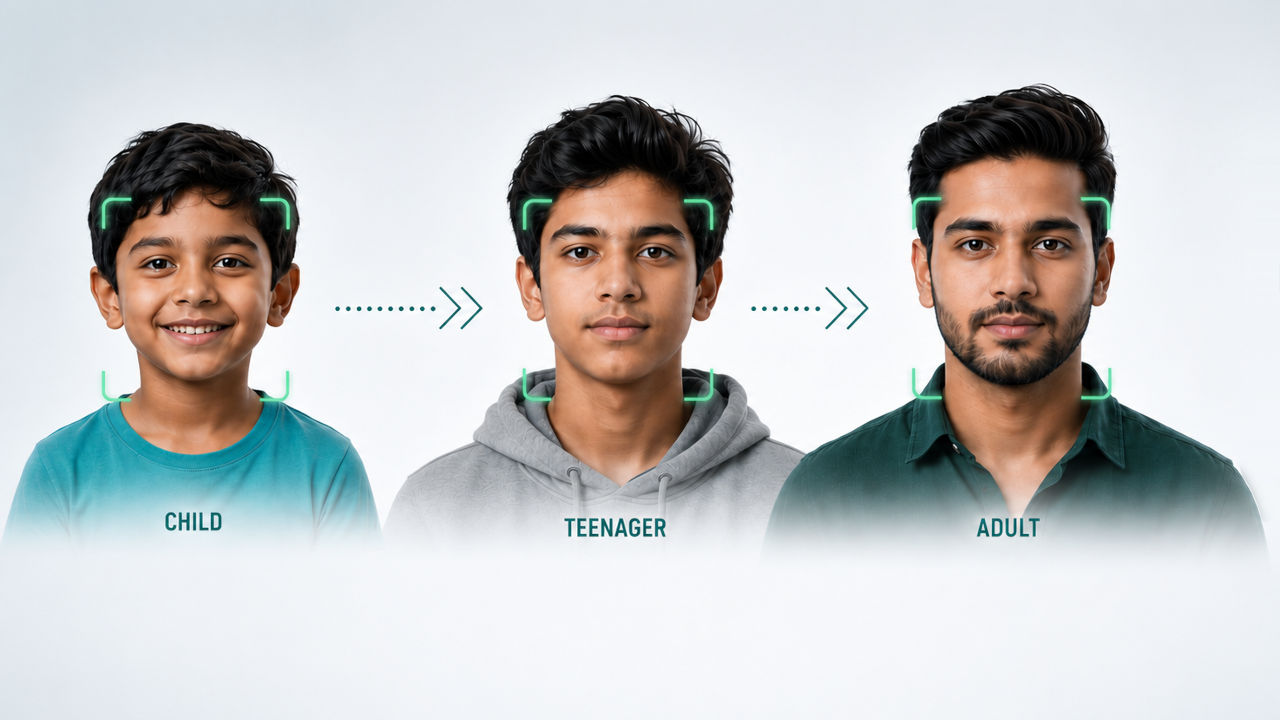
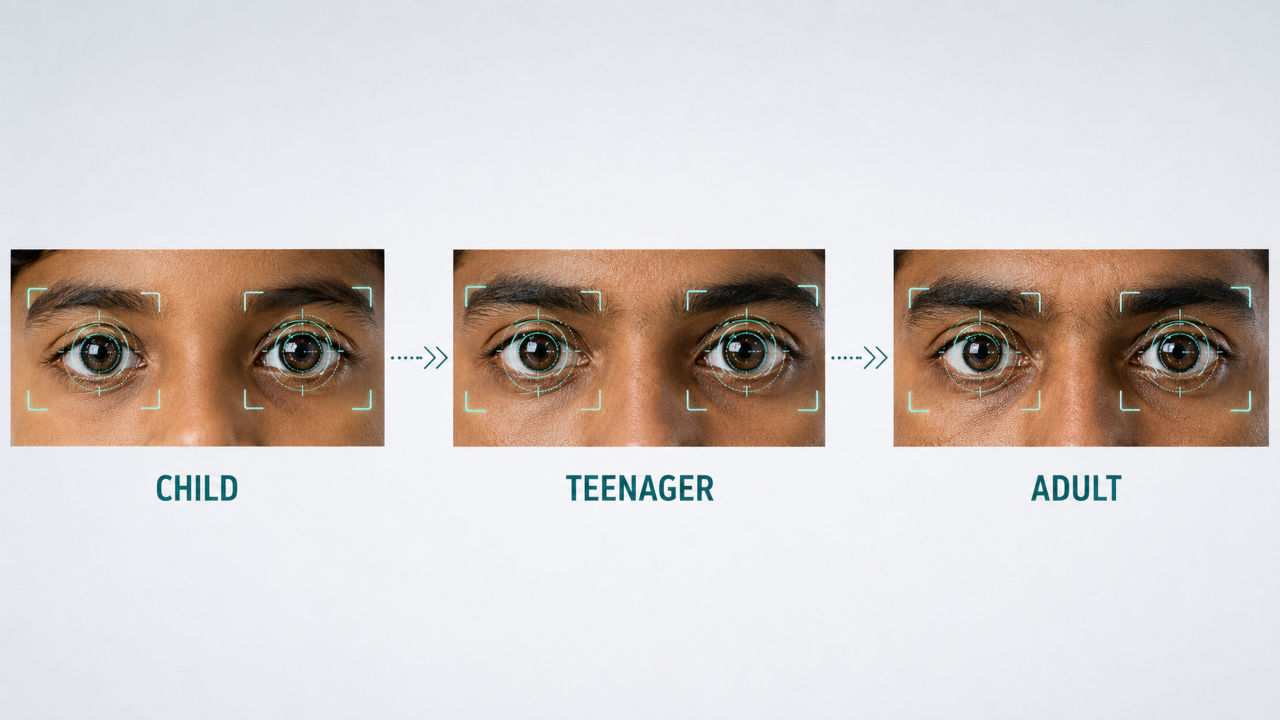
A distinctive feature of the challenge is its long-term age-variation dataset. Subjects were enrolled at ages 5–10 and then resampled 5–10 years later. This design tests how reliably a biometric algorithm identifies the same person as they grow up — a critical property for large-scale identity programs such as Aadhaar, where a person’s biometric record must remain accurate over many years.
See the UIDAI Biometrics SDK Benchmarking Challenge leaderboard for full details.
How results are measured
The leaderboard reports these metrics for each submission. All of them measure the accuracy of 1-to-1 biometric comparisons.
- AUC (Area Under the ROC Curve) — measures how well the algorithm separates genuine comparisons from impostor comparisons across all possible decision thresholds. A value of 1.0 means perfect separation; 0.5 means no better than chance. Higher is better.
- EER (Equal Error Rate) — the error rate at the threshold where false matches (an impostor incorrectly accepted) and false non-matches (a genuine pair incorrectly rejected) occur at equal rates. Lower is better.
- FMR1000 — the false non-match rate (a genuine pair incorrectly rejected) when the threshold is set so that 1 in 1,000 impostor comparisons is incorrectly accepted — that is, the FNMR at a fixed false match rate of 1/1,000. Lower is better.
- FMR10000 — the false non-match rate at the stricter setting where 1 in 10,000 impostor comparisons is incorrectly accepted — that is, the FNMR at a fixed false match rate of 1/10,000. Lower is better.
These metrics are all built from two underlying error rates:
- FMR (False Match Rate) is the fraction of impostor comparisons that are incorrectly accepted as a match. FMR is also known as FAR (false accept rate).
- FNMR (False Non-Match Rate) is the fraction of genuine comparisons that are incorrectly rejected. FNMR is also known as FRR (false reject rate).
See the UIDAI Biometrics SDK Benchmarking Challenge leaderboard for full evaluation methodology and all participant results (archived snapshot, June 8, 2026).
Disclaimers:
- The images on this page near the results of each algorithm submission are AI-generated synthetic visuals and are provided solely for illustrative purposes. They do not depict or correspond to any real person.
- Results shown from the UIDAI Biometrics SDK Benchmarking Challenge do not constitute endorsement by UIDAI or IIIT Hyderabad of any particular system.


