Reliability Tests
We present the testing results to show the template verification reliability evaluations for the VeriLook 2025.2 algorithm. The face liveness check algorithm was tested by BixeLab and certified as compliant with ISO 30107-3 Biometric Presentation Attack Detection Standards.
The following public datasets were used for the VeriLook 2025.2 algorithm face recognition reliability evaluations:
-
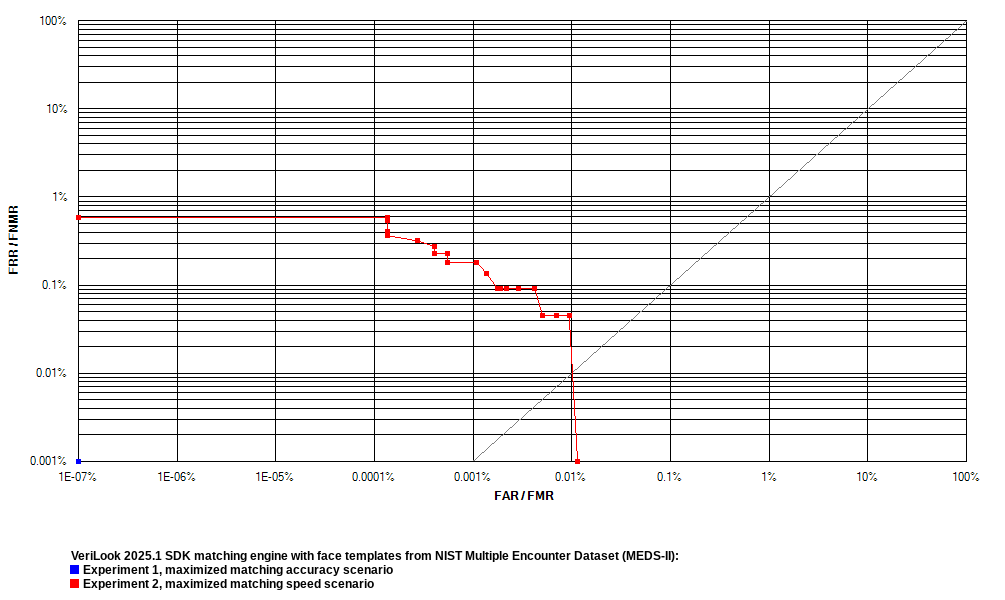
NIST Special Database 32 - Multiple Encounter Dataset (MEDS-II).
- All full-profile face images from the dataset were removed because they are not supported by VeriLook SDK. This resulted in 1,216 images of 518 persons.
-
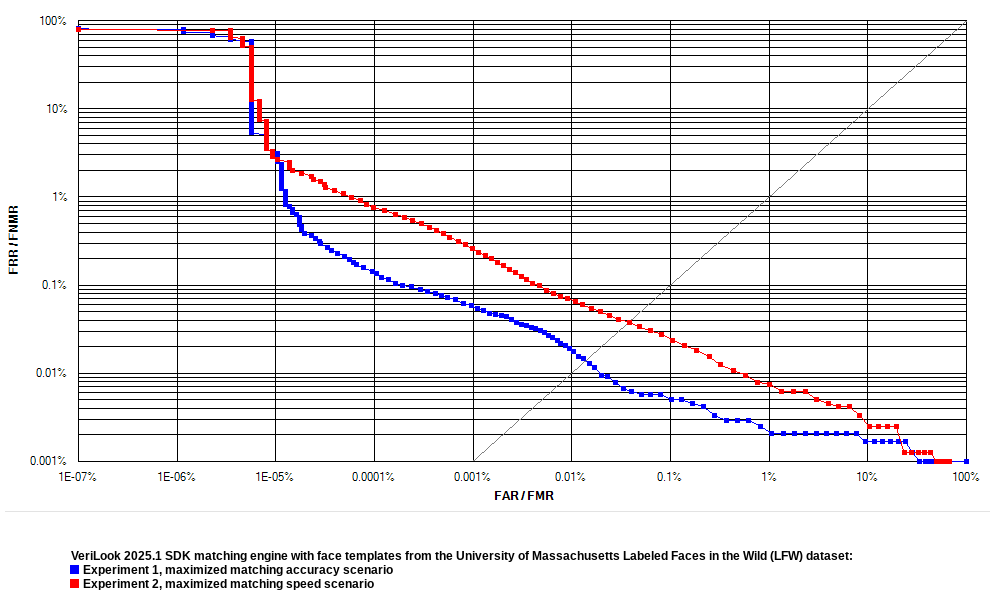
University of Massachusetts Labeled Faces in the Wild (LFW).
- According to the original protocol, only 6,000 pairs (3,000 genuine and 3,000 impostor) should be used to report the results. But recent algorithms are "very close to the maximum achievable by a perfect classifier" [source]. Instead, as Neurotechnology algorithms were not trained on any image from this dataset, verification results on matching each pair of all 13,233 face images of 5,729 persons were chosen to be reported.
- All identity mistakes, which had been mentioned on the LFW website, were fixed. Also, several not mentioned issues were fixed.
- Some images from the LFW dataset contained multiple faces. The correct faces for assigned identities were chosen manually to solve these ambiguities.
-
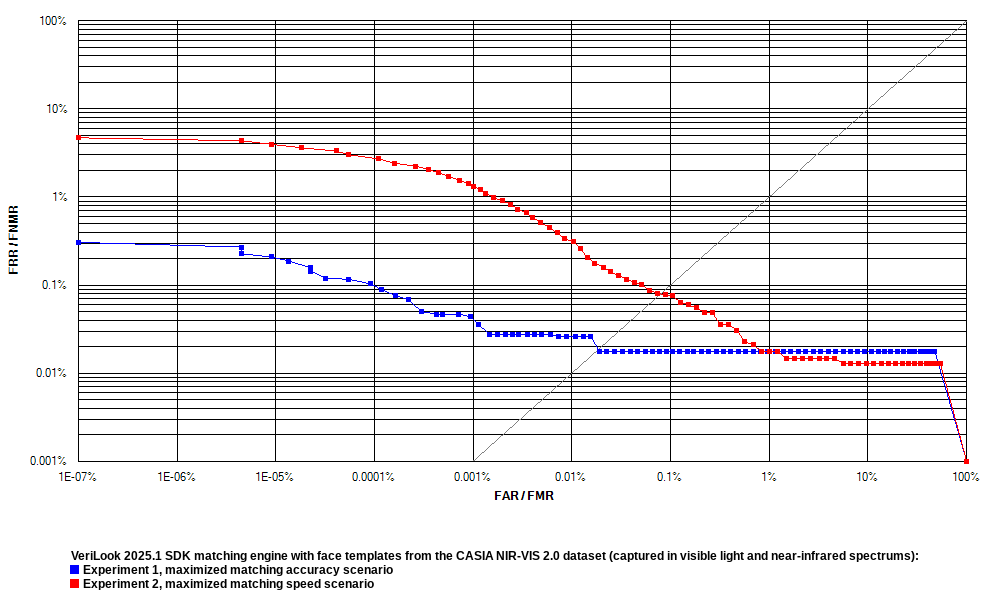
CASIA NIR-VIS 2.0 Database.
- The dataset contains face images, which were captured in visible light (VIS) and near-infrared (NIR) spectrums. According to the original protocol, VeriLook algorithm testing used VIS images as gallery, and NIR images as probe.
- According to the original protocol, the dataset is split into two parts – View1 intended for algorithm development and View2 for performance evaluation. Neurotechnology algorithms were not trained on any image from this dataset. Only View2 part with 12,393 NIR images and 2,564 VIS images was used for face verification evaluation.
- The non-cropped images (640 x 480 pixels) from the dataset were used for VeriLook algorithm testing.
Two experiments were performed with each dataset:
- Experiment 1 maximized matching accuracy. VeriLook 2025.2 algorithm reliability in this test is shown on the ROC charts as blue curves.
- Experiment 2 maximized matching speed. VeriLook 2025.2 algorithm reliability in this test is shown on the ROC charts as red curves.
Receiver operation characteristic (ROC) curves are usually used to demonstrate the recognition quality of an algorithm. ROC curves show the dependence of false rejection rate (FRR) on the false acceptance rate (FAR). Equal error rate (EER) is the rate at which both FAR and FRR are equal.
Click to zoom
Click to zoom
Click to zoom
| VeriLook 2025.2 algorithm testing results with face images from public datasets | ||||||
|---|---|---|---|---|---|---|
| MEDS-II | LFW | NIR-VIS 2.0 | ||||
| Exp. 1 | Exp. 2 | Exp. 1 | Exp. 2 | Exp. 1 | Exp. 2 | |
| Image count | 1216 | 13233 | 14957 | |||
| Subject count | 518 | 5729 | 725 | |||
| Session count | 1 - 18 | 1 - 530 | 4 | |||
| Image size (pixels) | variable | 250 x 250 | 480 x 640 | |||
| Template size (bytes) | 322 | 322 | 322 | 322 | 322 | 322 |
| EER | 0.0000 % | 0.0274 % | 0.0138 % | 0.0354 % | 0.0207 % | 0.0769 % |
| FRR at 0.1 % FAR | 0.0000 % | 0.0000 % | 0.0058 % | 0.0277 % | 0.0178 % | 0.0775 % |
| FRR at 0.01 % FAR | 0.0000 % | 0.0454 % | 0.0190 % | 0.0710 % | 0.0258 % | 0.3340 % |
| FRR at 0.001 % FAR | 0.0000 % | 0.1814 % | 0.0578 % | 0.2580 % | 0.0436 % | 1.4170 % |